Photo-induced Force Microscopy (PiFM)
Nano-IR PiFM Technology
1. Best of Nano-IR and Scanning Near-Field Optical Microscopy
2. Exceptional Spatial Resolution in Chemical Mapping
3. Excellent Sensitivity
4. Good Correlation between PiFM and Conventional IR Spectra
5. Universal Sample Applicability
6. Hyperspectral Nano-IR Imaging
PiFM – Best of Nano-IR and Scanning Near-Field Optical Microscopy
Nano-IR (nanoscale infrared spectroscopy) Photo-induced Force Microscopy (PiFM) is a combination of AFM and IR spectroscopy in a single instrument that acquires both topography and chemical signature(s) at the nanometer scale. PiFM demonstrates exceptional spatial resolution (~5 nm), excellent sensitivity (monolayer), and good correlation to bulk FTIR spectra. PiFM is universally applicable to a wide range of organic and inorganic materials.
Exceptional Spatial Resolution in Chemical Mapping

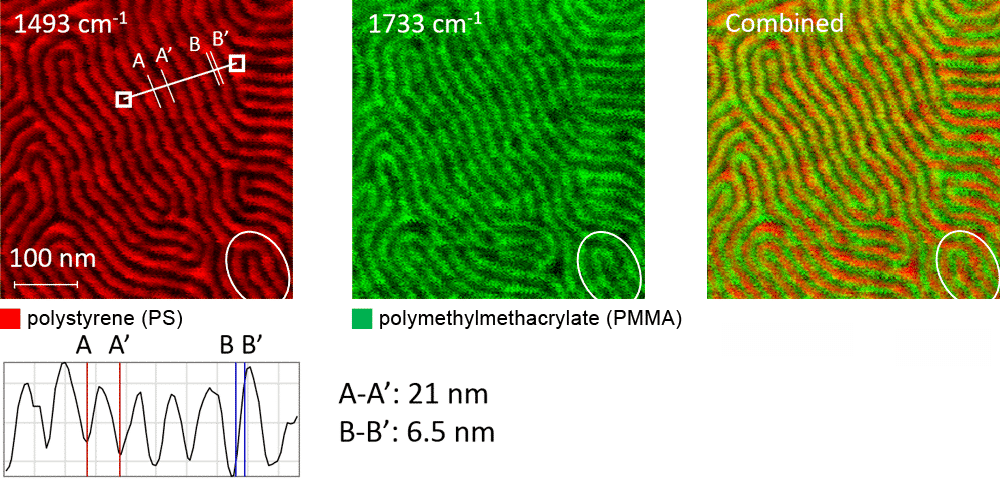
A block copolymer, with its well-defined distribution of chemical components, demonstrates well the spatial resolution of nano-IR instruments. In this sample of a polystyrene-polymethylmethacrylate block copolymer (PS-b-PMMA), each polymer lamella is ~11 nm wide. By setting the excitation laser to the 1493 cm-1 absorption band of PS, PiFM highlights just the PS components. Likewise, by setting the excitation laser to the 1733 cm-1 absorption band of PMMA, PiFM highlights just the PMMA components. The two domains are complementary, easily visualized in the region in the white circle. The cross-section shows the ~5 nm lateral resolution.
Other nano-IR techniques have yet to show separate images of distinct chemical components imaged at the associated IR bands on such tightly packed BCP.
Excellent Sensitivity

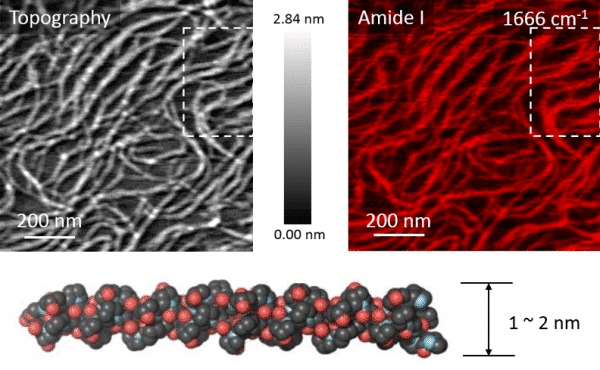
Triple helix collagen consists of three twisted chains of a repeat amino acid sequence with a diameter of ~2 nm. A PiFM image taken at the amide I band’s 1666cm-1 absorption displays strong signals from the individual triple helices.
Good Correlation between PiFM and Conventional IR Spectra

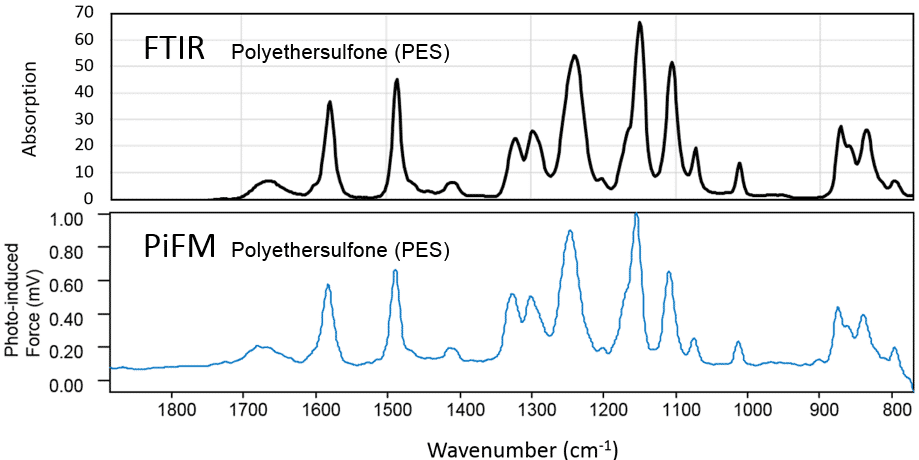
PiFM spectra generally correlate well with conventional IR spectra from bulk samples. Above, PiFM spectrum recorded on a thin polymer (PES) film (blue trace) agrees well with FTIR spectrum recorded from bulk polymer (black trace).
It is not unusual for peak amplitudes to shift on going from bulk FTIR images to surface PiFM images, a manifestation of the different molecular environments experienced in the two cases.
Universal Sample Applicability

The PiFM image on the left combines two images at 941 cm-1 (green for FePO4) and 1054 cm-1 (red for LiFePO4) to show delithiation of LiFePO4 submicron crystals.
The middle image qualitatively shows local SiO2 stress based on the magnitude of the 1113 cm-1 absorption line (Si-O bond). The dark vertical lines are areas composed of SiGe and the red areas are composed of SiO2. The cross-section shows that the Si-O bond gradually recovers to the unstrained condition about 400 nm away from the last SiGe line. The cross-section also shows that in between the SiGe lines, strain reduces the Si-O band amplitude.
On the right, contrast in the PiFM image of a flake of hexagonal boron nitride follows the contours of the surface phonon polariton.
Hyperspectral Nano-IR Imaging

hyPIR (hyperspectral infrared PiFM) images consist of (n x n) pixels of PiFM spectra. Due to the sensitivity of PiFM, a nanoscale hyPIR image with 128 x 128 pixels can be generated in about an hour. It is a powerful way to analyze unknown samples. See the hyPIR movie of surface phonon polariton (SPP) on hexagonal boron nitride (hBN).
Contact us for more information on this product
Would you like an estimatation ?
Additional information?
We will reply to you within 24 hours


