EDS : Quantitative measurement of the elements
Oxford EDS – Ultim® Max EDS with AZtecLive
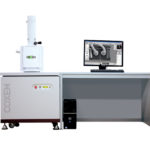
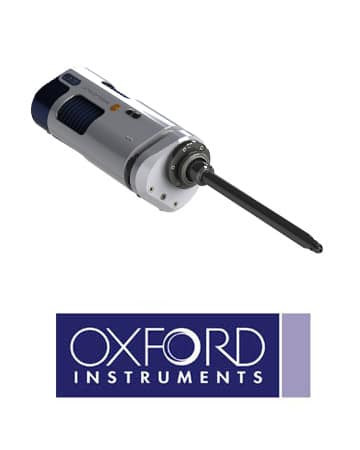
The Oxford Ultim® Max EDS series from Oxford Instruments is available in detector sizes of 40, 65, 100 or 170 mm² for the complete SEM CX-200plus using Oxford's famous AZtecLive software platform for simple elemental micro-analysis or advanced. The more affordable AZtecOne software platform designed for novice users or basic EDS microanalysis is also available.
- automated analysis of characteristics / particle
- Automatic mapping and mapping EDS on large surfaces
- metal inclusion analysis (steel cleanliness - ASTM E1245 / E2142 / E45)
- mineral phase analysis, liberation of minerals, modal mineralogy, petrography
- Residues of shots - GSR (ASTM E1588)
- General analysis of the particles for cleanliness (ISO 16431/18413, 1246D IEST)
- Analyzing wear particles (ARP 598c, ASTM D7416, ASTM F311 / F312, ISO 16232-8, ISO 4407)
- environmental particles on filters or wipes (ASTM D6059, ASTM E2090, ISO 14966)
- Particulate contamination in parenteral injections and infusions (USP 788)
The Oxford AZTecLive software offers several optional dedicated analysis modules to facilitate the implementation of complex analyzes. LayerProbe is an exciting new software tool for analysis of thin layers in the SEM. LayerProbe is faster, cheaper and with a higher resolution than measurement tools dedicated to thin films
Oxford EDS – AZtecOne for Full-Size SEM
Scanning electron microscopy
Adding Oxford EDS to your SEM makes it a very powerful analysis tool, offering a multitude of functionalities using advanced micro-analysis functionalities for elementary analysis. With an optimal take-off angle, the EDS signal is collected at an optimal solid angle.
Main features of Oxford AZtecOne EDS
- High speed SDD detector (no LN2 required)
- Energy resolution: less than 133 eV (in Mn Ka)
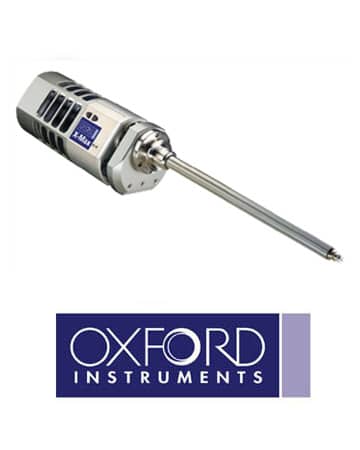
- Detector area: 10mm² (X-ACT) or 20mm² (X-MaxN)
- Element detection range: Be (4) - Am (95)
- Maximum input count rate:> 100 kcps
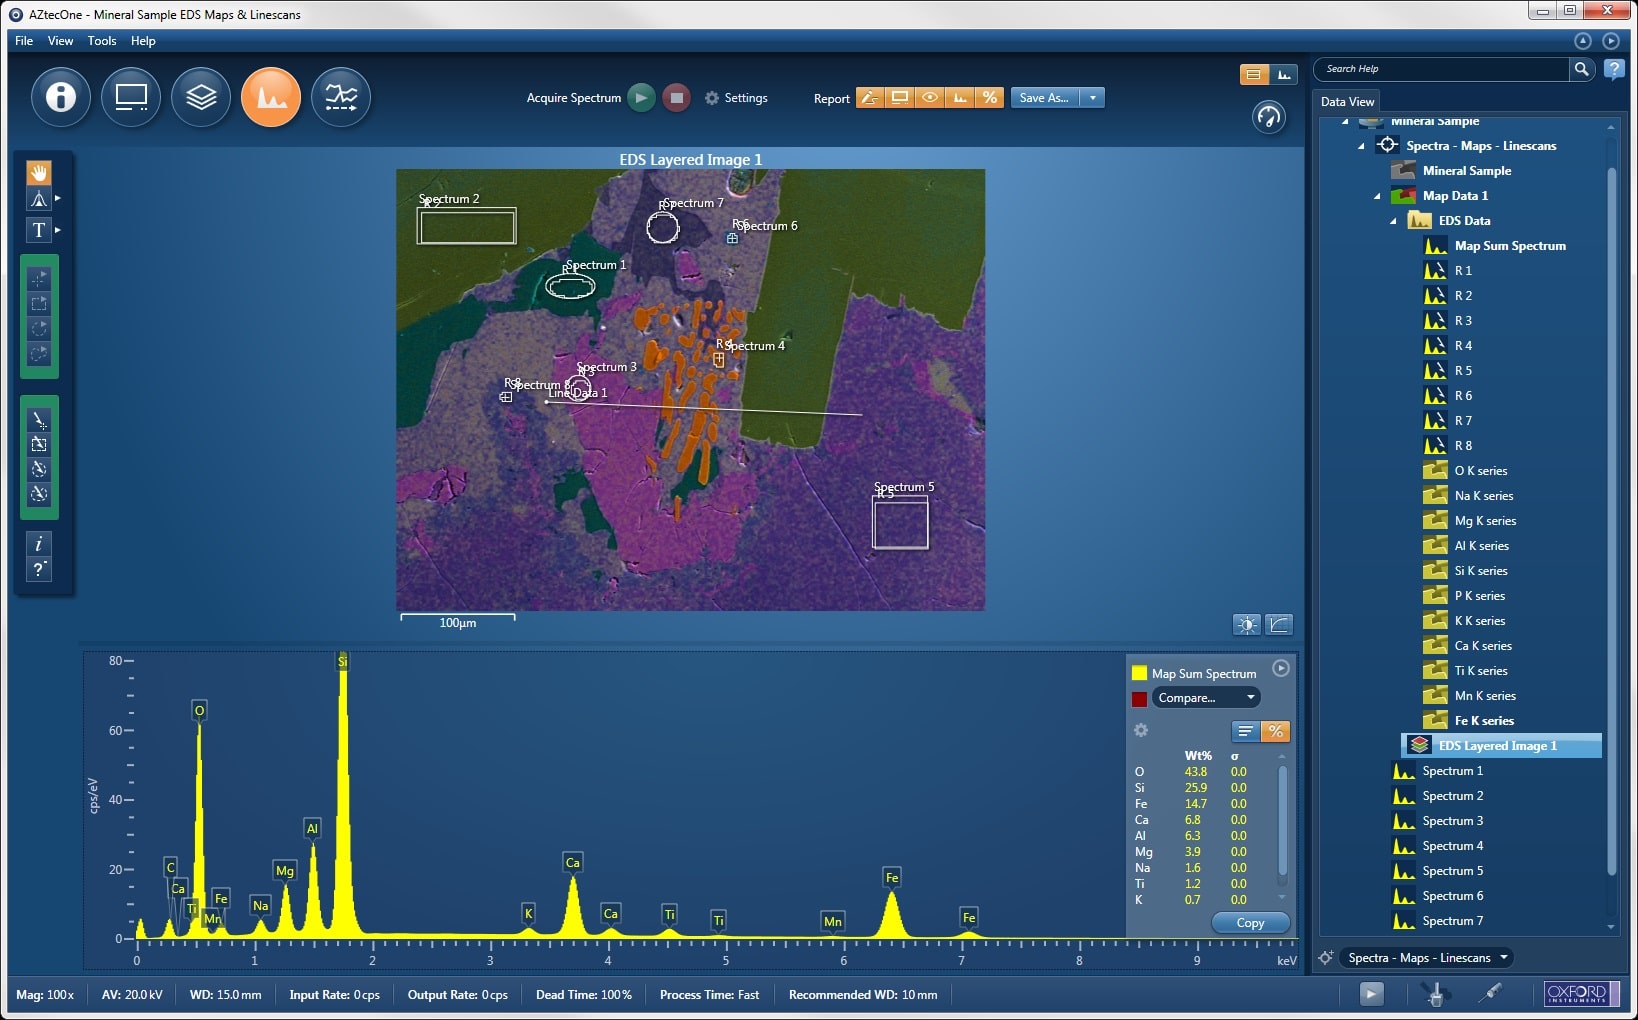
- Software: qualitative or quantitative analysis
- Analysis modes: point, circle, polygon, linear scan, mapping
Composition of points / zones
- The software has easy to use functionalities for the analysis of the composition in points, rectangles, circles and polygons
- A quick and precise qualitative or quantitative analysis with quantification without standards is standard
- Tru-Q® algorithms optimized to improve quantified results
Cartography
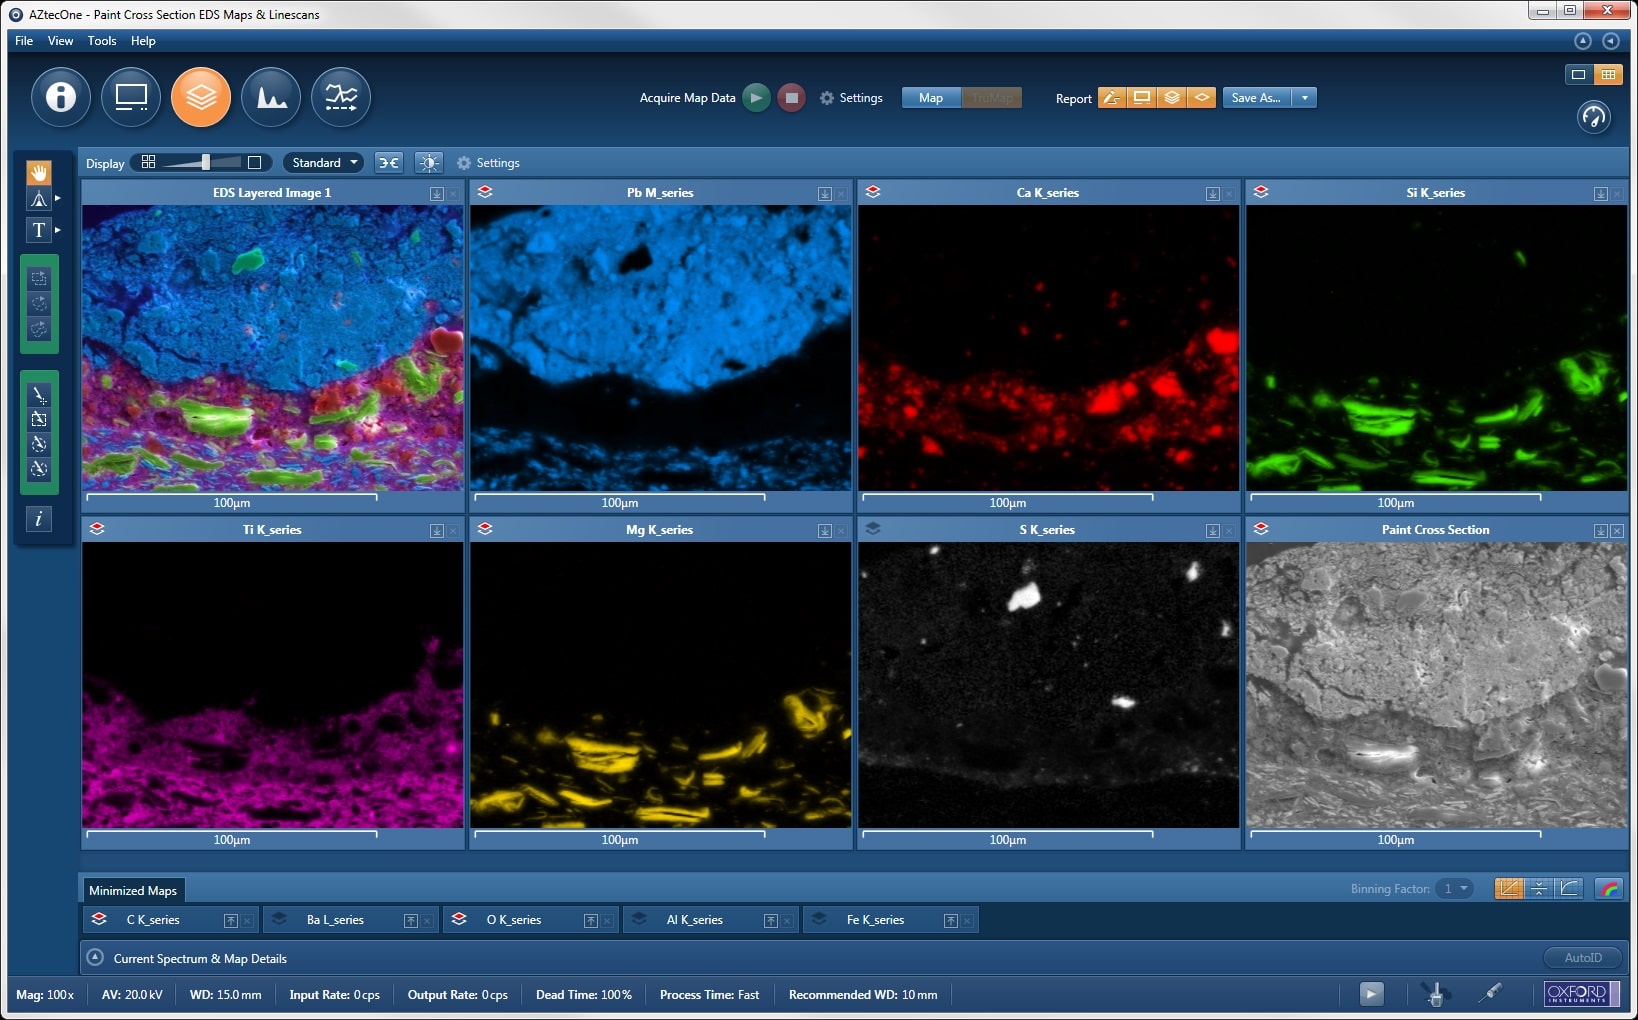
- Fast and high resolution cartographic analysis with the Oxford data cube
- Mapping provides the function of analyzing the distribution of elements
- Distribution cards of individual items can be divided and saved separately
- Various user settings to save formats, colors, depth, filters, etc.
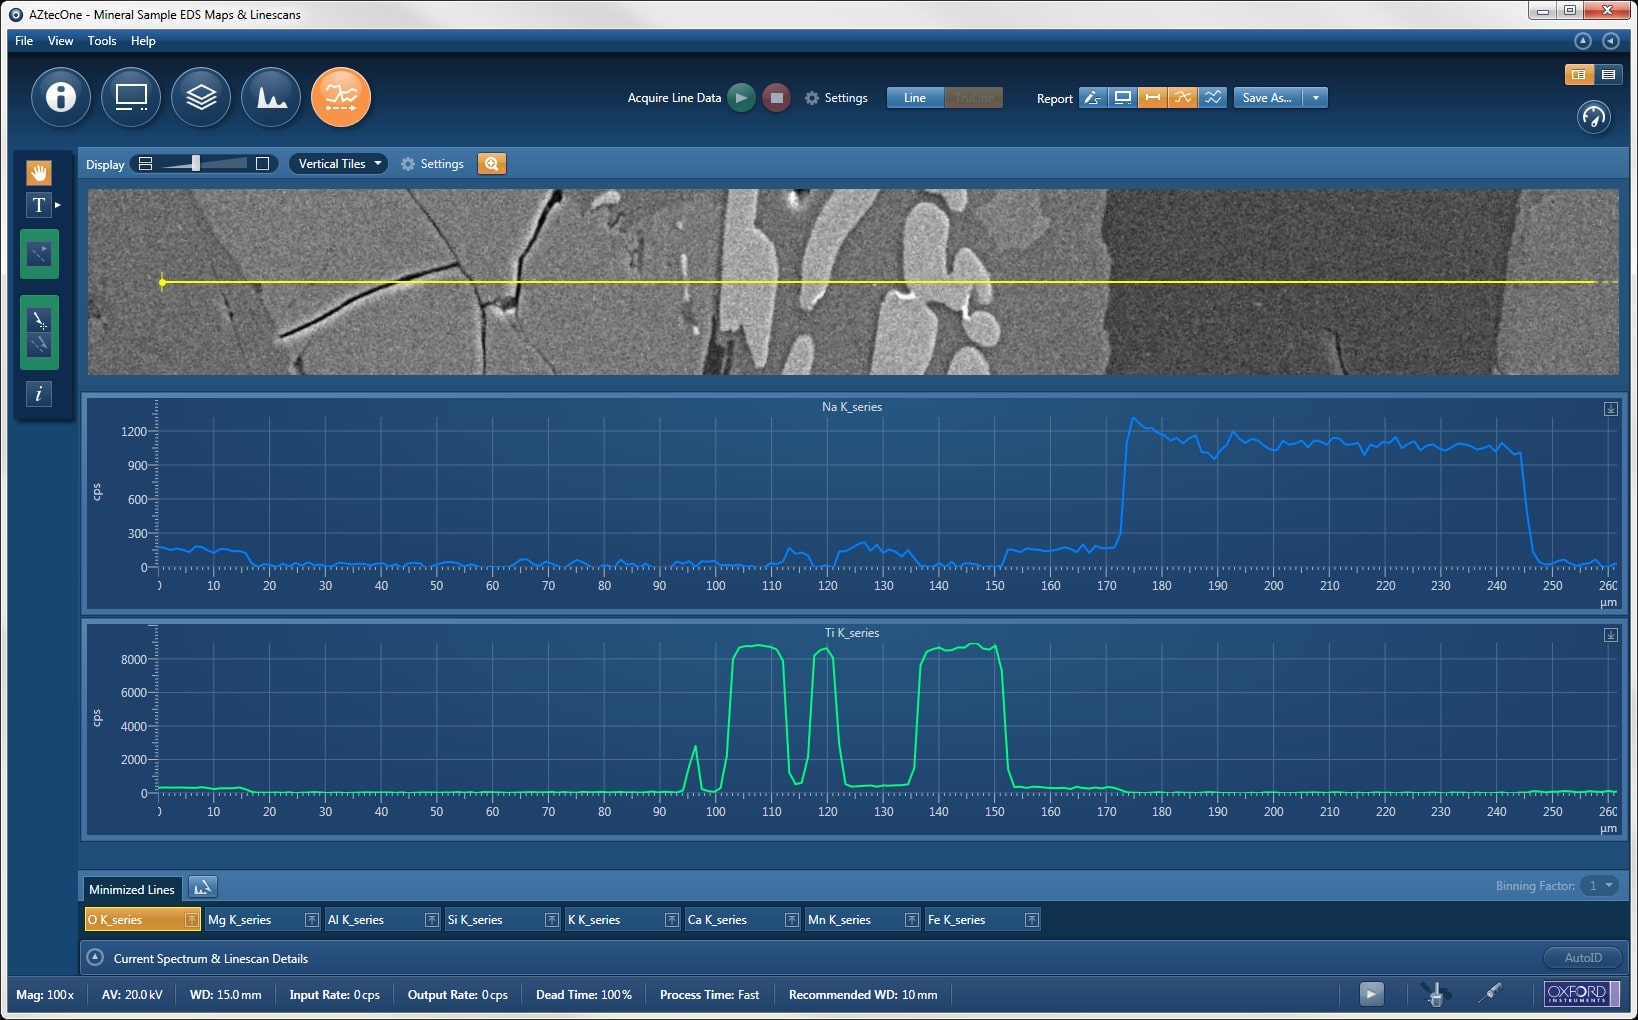
Line scan
- Draw the ROI (region of interest) with a line and analyze the elements along this line
- Easy to compare the basic difference between ROI and line profile graph
- Very useful for cross section thickness analysis of multi-layer samples including the mixing zone
- Various user settings to save formats, colors, line scan width, filters, etc.
Report
- Quick and easy report function
- Save one-click reports in MS Word
Bruker EDS – XFlash® 630
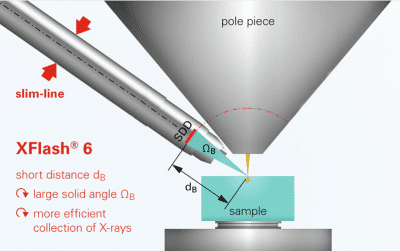
Adding Bruker EDS to your SEM makes it a very powerful analysis tool allowing a multitude of functionalities using advanced microanalysis functionalities for elementary analysis. With the most optimal launch angle of all table SEMs, the EDS signal is collected at an optimal solid angle, unlike other table SEM designs.
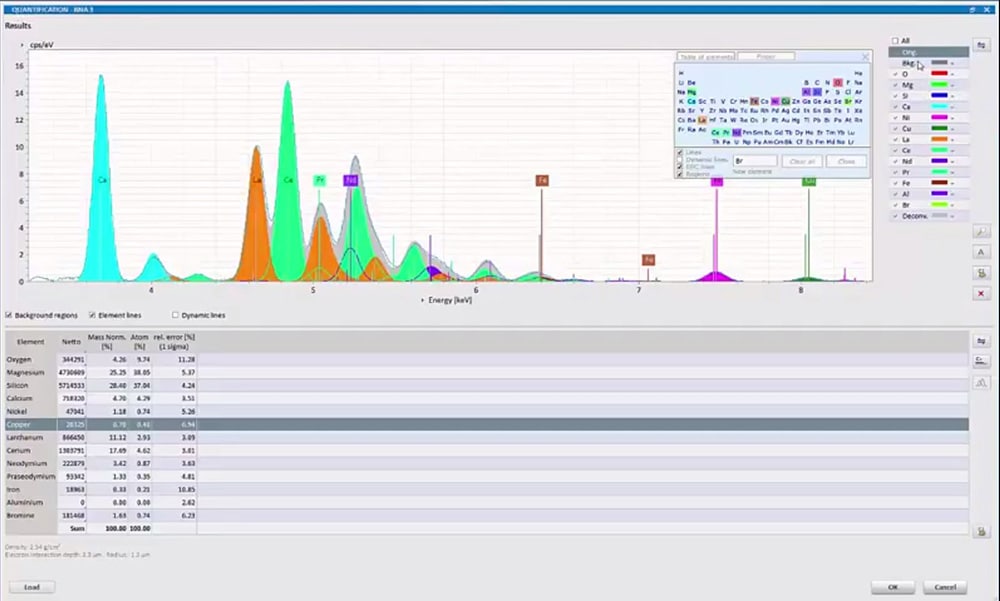
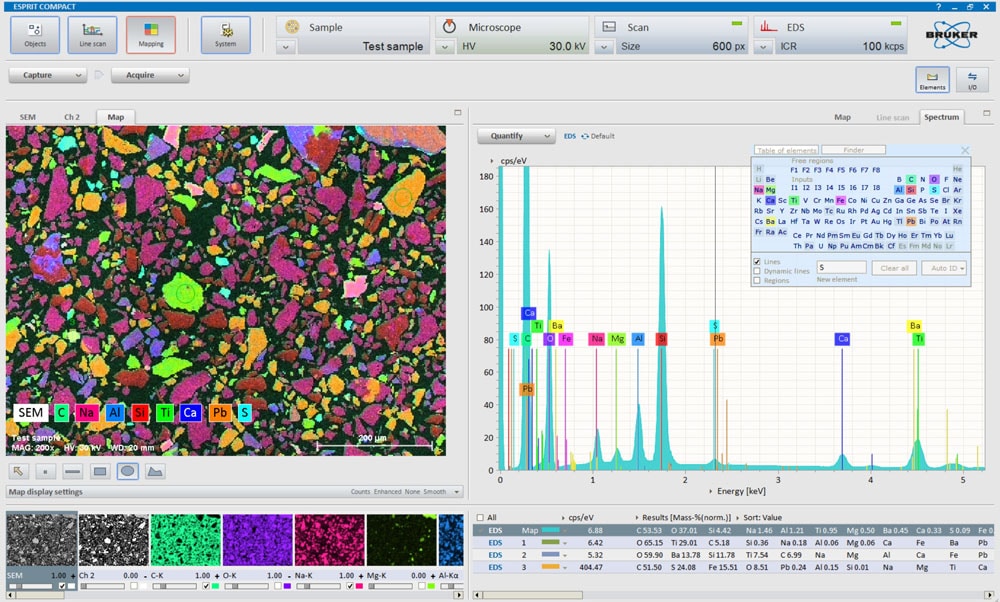
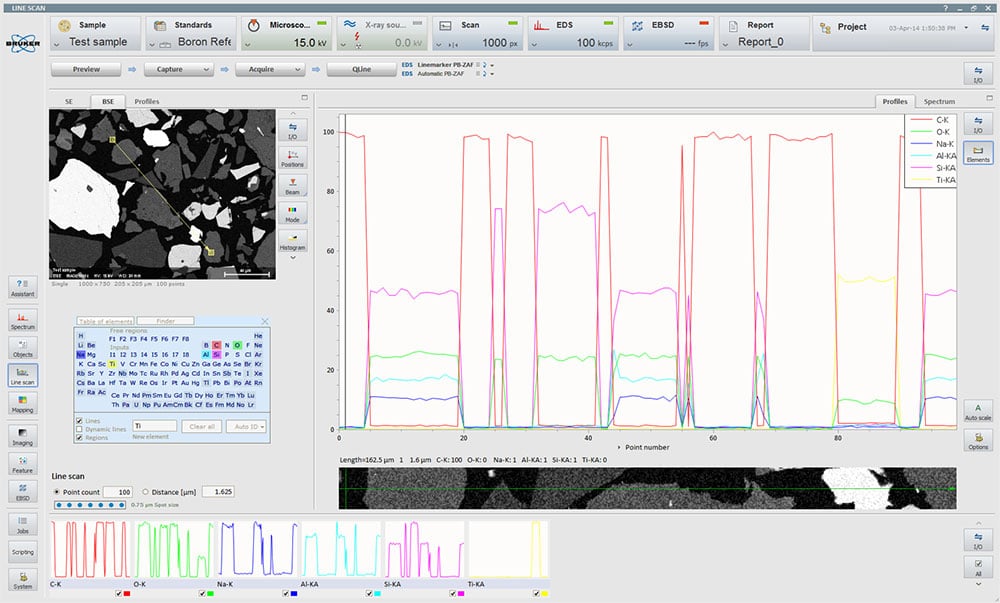
The Bruker ESPRIT Compact software offers many functions for analyzing the composition, thickness and mapping of samples, as shown in the screenshots and explanations below.
Contact us for a more in-depth discussion of the benefits of upgrading to Bruker QUANTAX 200 software for more advanced features such as:
- Metal inclusion analysis (steel cleanliness - ASTM E1245 / E2142 / E45)
- Analysis in mineral phase, release of minerals, modal mineralogy, petrography
- Gunshot residue - GSR (ASTM E1588)
General analysis of particles for cleanliness (ISO 16431/18413, IEST 1246D)
- Analysis of wear particles (ARP 598c, ASTM D7416, ASTM F311 / F312, ISO 16232-8, ISO 4407)
- Environmental particles on filters or wipes (ASTM D6059, ASTM E2090, ISO 14966)
- Particulate contamination in parenteral injections and infusions (USP 788)
Bruker EDS Quantax 200 software offers several dedicated modules and databases to help you perform these common types of analysis.
XFlash® 630 EDS main specifications
- High speed integrated type SDD detector (no LN2 required)
- Energy resolution: Less than 129 eV (in Mn Ka)
- Detector area: 30mm
- Element detection range: B (5) - Am (95)
- Maximum input count rate:> 150 kcps
- Software: qualitative or quantitative analysis
- Analysis modes: point, circle, polygon, linear scan, mapping
Composition of points / zones
- The software has easy to use functionalities for the analysis of the composition in points, rectangles, circles and polygons
- A quick and precise qualitative or quantitative analysis with the possibility of calibration is standard
- Improved deconvolution capabilities significantly improve quantified results
Mapping
- Fast and high resolution cartographic analysis with Bruker's HyperMap
- Mapping provides the function of analyzing the distribution of elements
- Distribution cards of individual items can be divided and saved separately
- The spectra of each pixel are recorded in a database for later recall and manipulation of the analysis by point or line scanning.
- Various user settings to save formats, colors, depth, filters, etc
- Draw the ROI (region of interest) with a line and analyze the elements along this line
- Easy to compare the basic difference between ROI and line profile graph
- Very useful for cross section thickness analysis of multi-layer samples including the mixing zone
- Various user settings to save formats, colors, line scan width, filters, etc.
Report
- A variety of report formats are provided and can be changed at will
- Save reports in Word or PDF format with one click
EDAX Element EDS
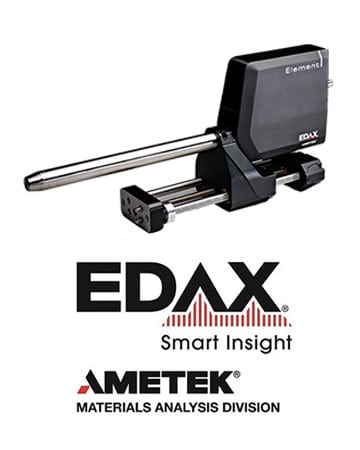
EDAX Element EDS with APEX ™ software for simple or advanced elemental micro-analysis
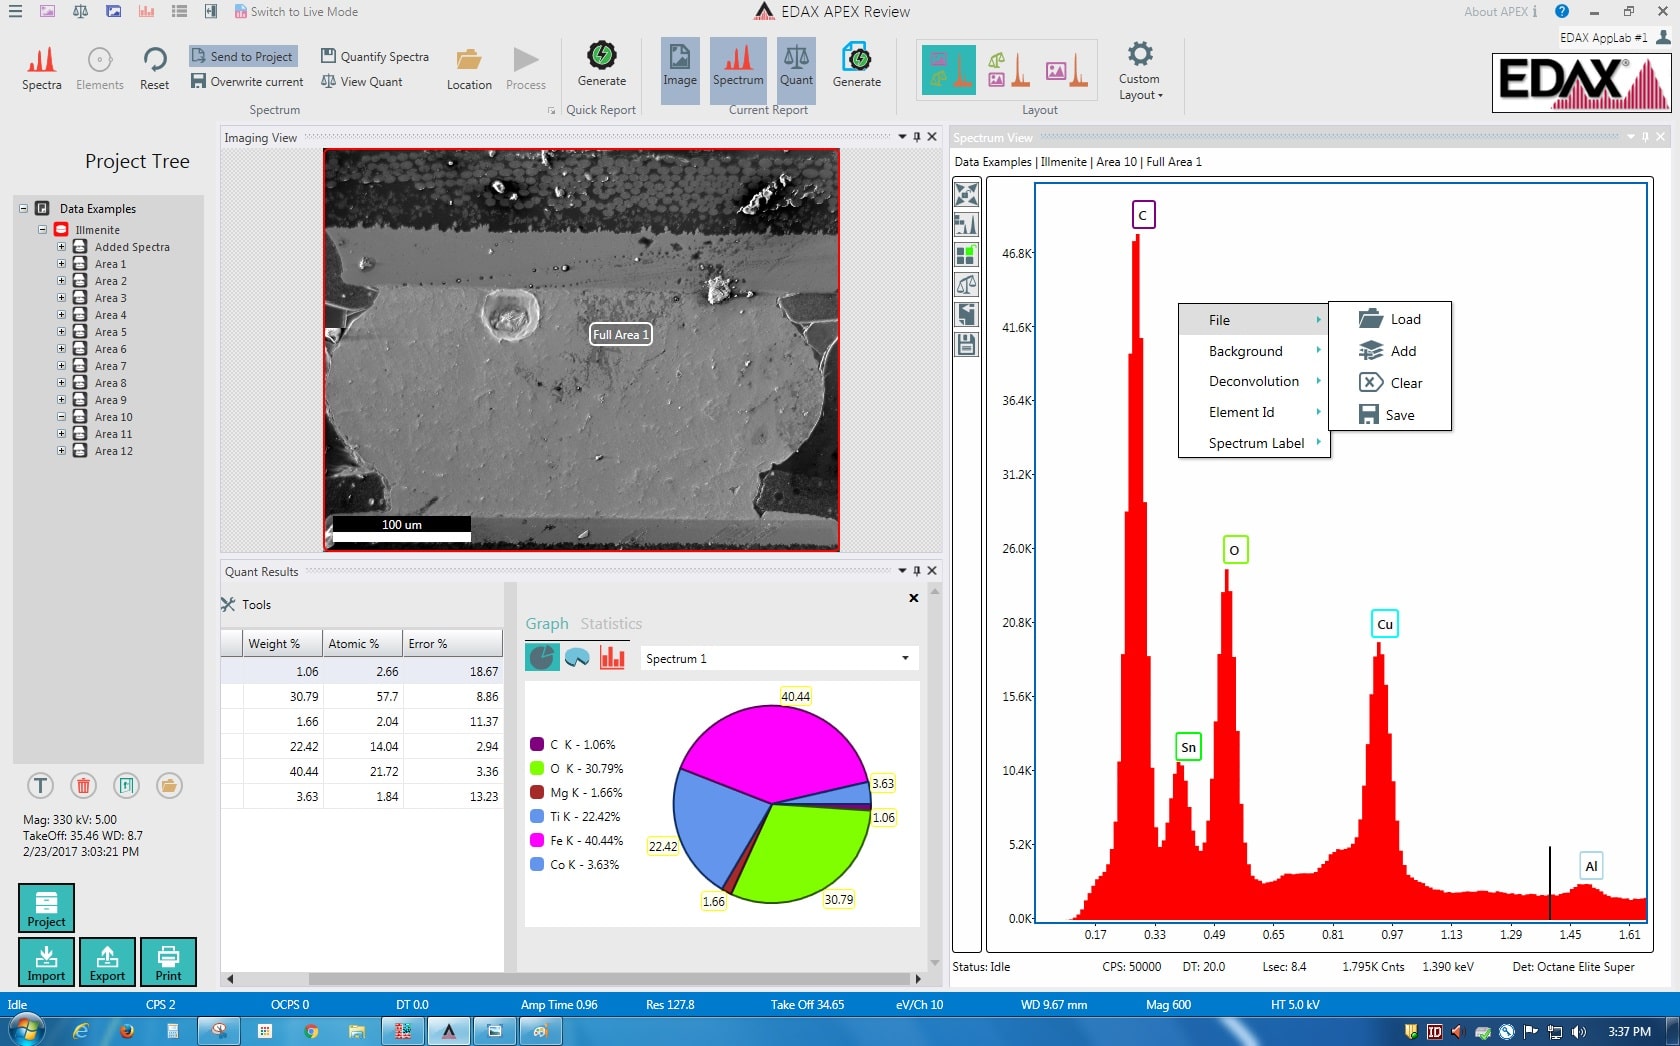
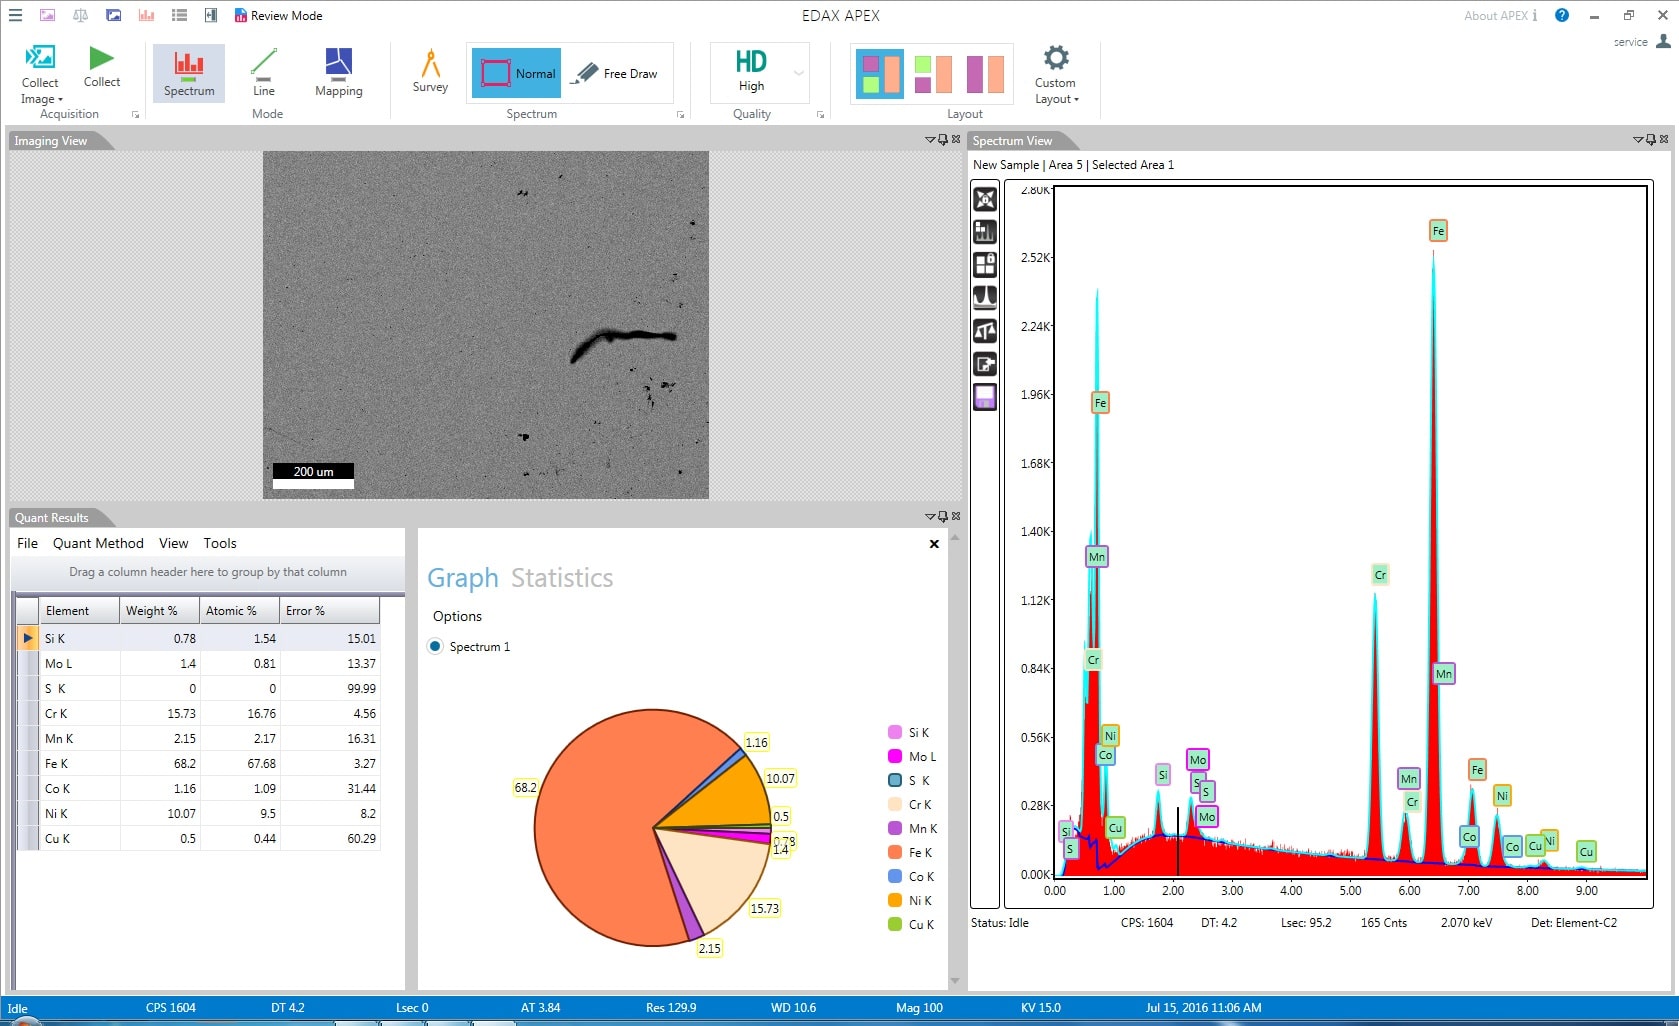
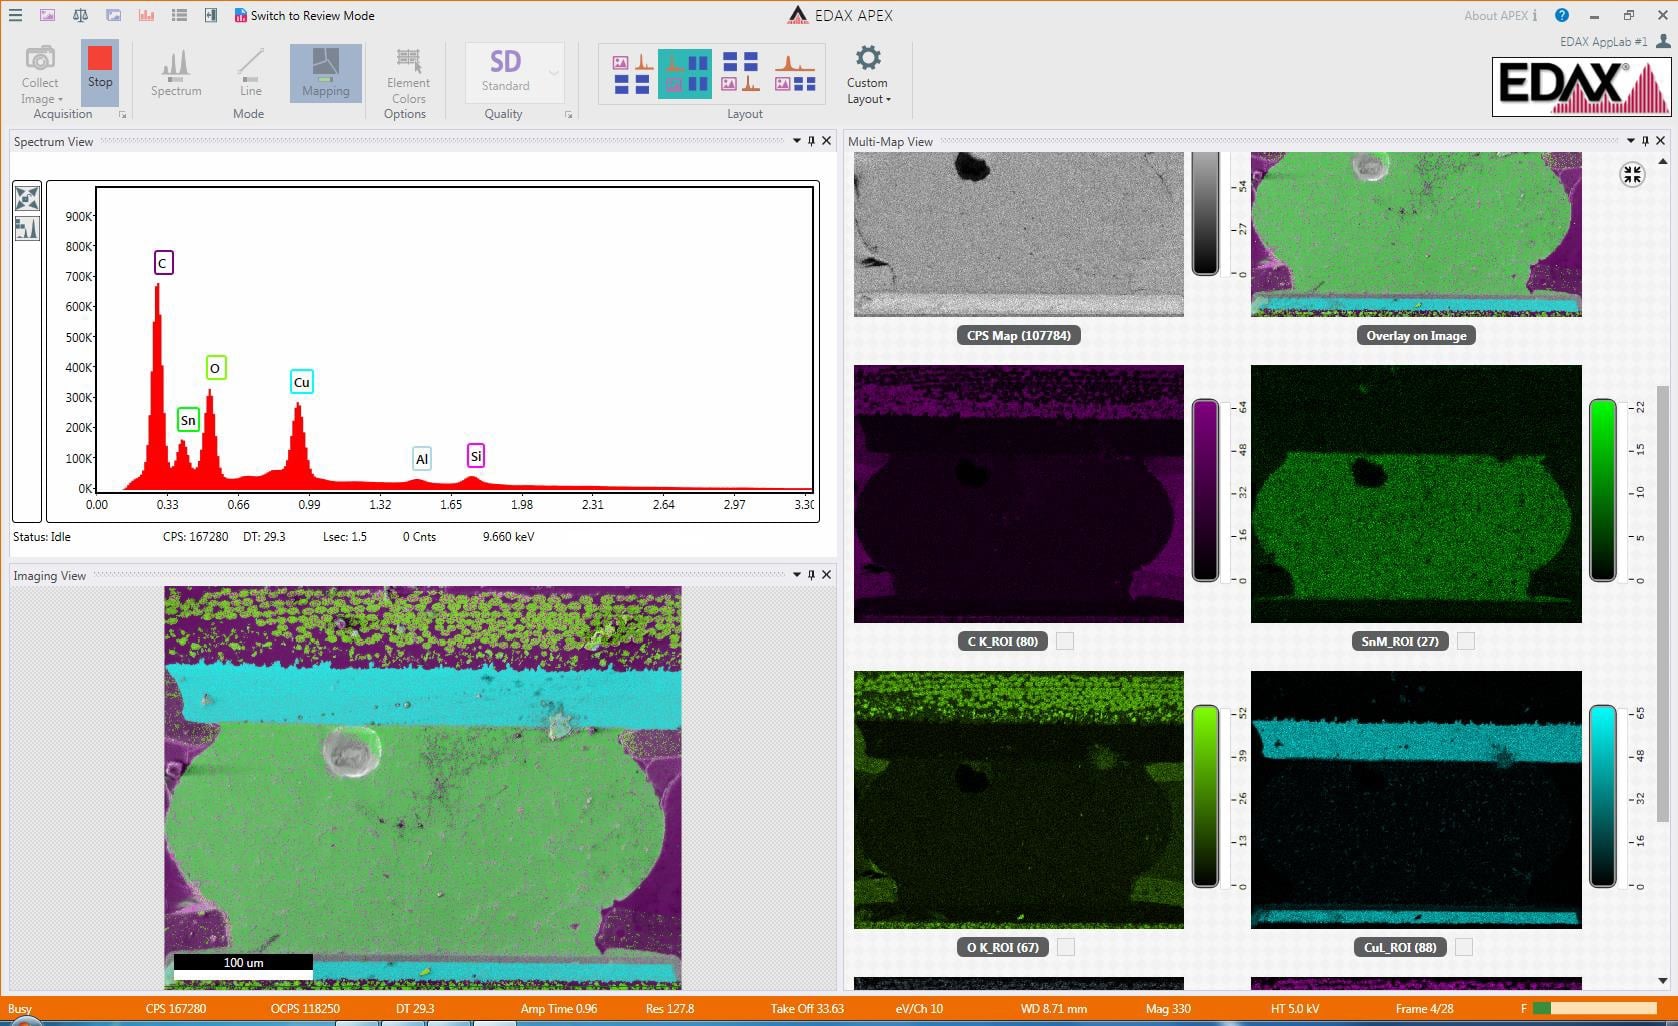
Adding EDS to your SEM makes it a very powerful analysis tool allowing a multitude of functionalities using advanced micro-analysis functionalities for elementary analysis. EDAX APEX ™ software offers many features for analyzing the composition, thickness and mapping of samples, as shown in the screenshots and explanations below.
EDS Element Main Specifications
- High speed integrated type SDD detector (no LN2 required)
- Energy resolution: less than 133 eV (in Mn Ka)
- Detector area: 30mm
- Window: Silicon nitride (Si3N4)
- Element detection range: Be (4) - Am (95)
- Maximum input count rate:> 300 kcps
- Software: qualitative or quantitative analysis
- Analysis modes: point, circle, polygon, linear scan, mapping
- Touch mode
Software
The APEX ™ software is an idealized program developed for novice users with analysis functions for elementary qualitative or quantitative analysis, cartography, online scanning and the creation of integrated reports. APEX ™ is designed with a “project” methodology.
EDAX Element EDS with APEX software - Project
Intuitive and adjustable user interface
Operators can start based on inspection parameters when they have been saved and analysis processes can be carried out with minimal effort. "Only 3 clicks" were required to collect a spectrum for qualitative, quantitative analysis and backup. Several screen layouts are easily defined with a single click of the mouse. Background colors can be set for a light or dark preference.
Qualitative / quantitative analysis
- Able to know the item and the quantity on an unknown sample in a short time (less than a minute)
- Obtain information on the area to see quickly and easily by different scanning methods (point, area, etc.).
- Reliable analysis of the elements and 3 types of tables or comparison tables listing the elements by weight (% by weight), atomic (at%) and error (%)
- ZAF corrections and analysis results tablesAble to know the item and the quantity on an unknown sample in a short time (less than a minute)
- Obtain information on the area to see quickly and easily by different scanning methods (point, area, etc.).
- Reliable analysis of the elements and 3 types of tables or comparison tables listing the elements by weight (% by weight), atomic (at%) and error (%)
- ZAF corrections and analysis results tables
Multi-point analysis
- Mark multiple locations to inspect in the sample by point, area, or other scanning method
- Analyze and save automatically
- Improve the reliability of the analysis results by carrying out 4 conditions for analyzing the selected area
High speed mapping
- Easily analyze the distribution of sample elements with a different color code
- Obtain the desired information in real time at low resolution or high resolution with short analysis times
Line scan
- Another way to check the distribution of the sample elements. Analyze with the line defined by user and clearly associate the distribution of each element.
- Create an online SEM image scan overlap and an element profile
Report
- After acquiring the results, reports can be generated as needed by the user, showing all of the acquired data in different formats.
- Possibility to modify or modify by saving the original file in MS Word, Excel or PowerPoint formats or in PDF

Contact us for more information on this product
Would you like an estimatation ?
Additional information?
We will reply to you within 24 hours


